
Knockout.js Binding Report for Performance Tuning
I use a lot of Knockout.js on Keep Track of My Games. I love Knockout but sometimes it makes it difficult to understand what's slowing my page down.
For the game list, there's a lot of binding going on because I have to bind not only the list of games but also the toolbar.
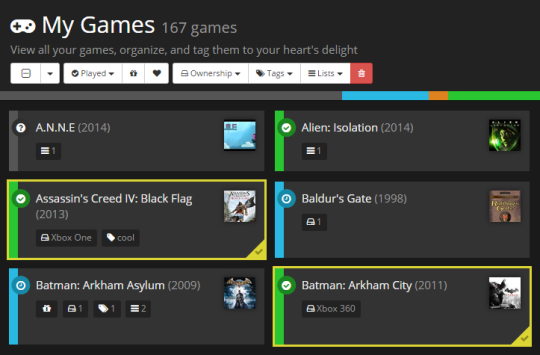
Before I deploy the newest update (shown above), I'd prefer it if the list binding performance was better than it is now. Currently there's a visible block on the UI thread when returning results from the API, about 500-1000ms. This is unacceptable.
A quick Google search did not yield anything regarding a "real" performance tool for Knockout. What I would love is an extension that would overlay performance statistics over the UI of my app after binding is complete. This way I could visualize and easily pinpoint what bindings are causing performance issues.
I've made a small step towards that dream by creating a simple reporting script that outputs a "binding report" to the Chrome console:
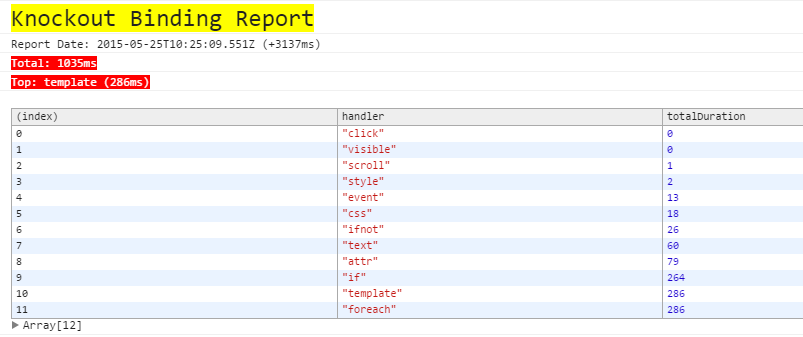
The report displays the total duration of the binding process (which is all bindings that occur after a 500ms wait time) as well as the top binding according to total duration.
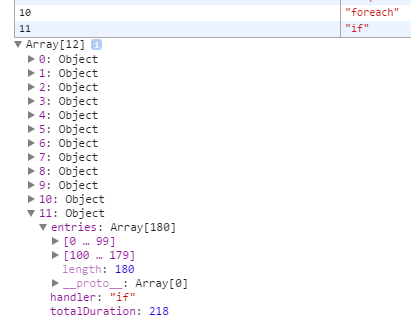
It also displays each binding summary in a table (console.table). You can drill-down by expanding the array entries underneath the table (sorted by duration).
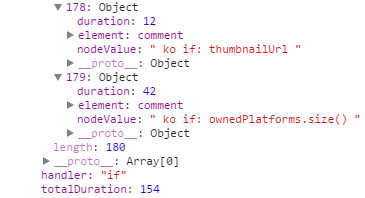
The script works by wrapping all the binding handlers (even custom ones) in a wrapper function that calculates the duration of the call to init or update. You just need to include it after your custom binding handlers and before the applyBindings call.
The script requires Underscore and Google Chrome. Here's the gist:
As you can see in my own performance report, I have some work to do to fix my if bindings. It doesn't exactly pinpoint the problem binding, but it gets me a step closer to understanding what's going on.
Now if you'll execuse me, I've got some work to do.
Update: Using this little script, I was able to get down to <150ms from 600-900ms (and this is a slow laptop). This is much more acceptable for a release this week!